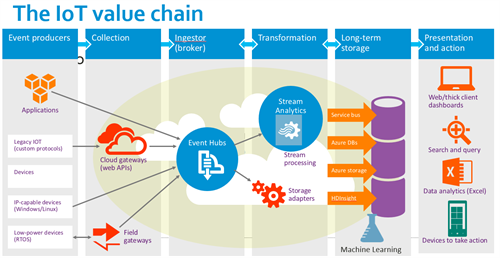
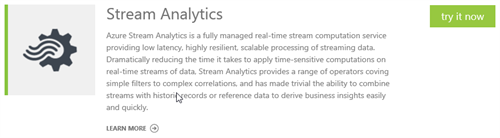
Azure Stream Analytics is a very interesting service on the Azure platform that allows developers and data analysts to get interesting information or events out of a stream of incoming events. The service is part of the typical IoT value chain and is positioned in the transformation part. The following picture is taken from a Microsoft presentation on IoT and shows Stream Analytics, connected with Event Hubs.
This post explains how you can start using Azure Stream Analytics and covers some troubleshooting tips that should save you some time. My scenario will explain how you can send data through the Azure Event Hubs and how you can apply the standing queries of Azure Stream Analytics to get some added value out of the incoming stream.
In my scenarios and this post, I will solely focus on Azure Event Hubs as the input for my jobs. You can use blobs as well, but I believe Event Hubs is the closest match with the integration world.
Typical scenarios for Complex Event Processing
I tried to describe some of the typical scenarios where Stream analytics can be used. But on the high level, you can say that any scenario that needs to get intelligence out of incoming streams by correlating events should be a good fit for ASA (the abbreviation of Azure Stream Analytics).
Noise reduction
When talking with customers on frequency of incoming events (for example sensor data), we see often that there’s a tendency to send data in a higher frequency that mostly needed. While this has some advantages (better accuracy), this is not always needed. The higher the frequency of ingested events, the higher the ingestion costs. (potential extra data transfer costs on the device side and higher number of incoming events). Typically the ingestion costs are not that high (when using Azure Event Hubs, for example you pay around 2 cents for 1mio events), but the long term storage cost is always higher (as the data mostly increases each month and you pay for the same data every month again).
That’s why it would be good to reduce the incoming stream with the high frequency into an aggregated (averages/sums) output stream to the long term storage. Then still you benefit from the higher accuracy, but you save on the expensive cold storage.
Enrich events with reference data
It is possible to join the incoming data with reference tables/data. This allows you to build in decision logic. For example, you could have a table with all the devices and their region or customer. And you could use that extra information to join with the telemetry information. (using the DeviceId) and aggregate per region, customer etc.
Leverage multiple outputs (pub-sub style)
When using Azure Event Hubs, it is perfectly possible to create multiple ASA jobs that share the same EventHub as their input. This allows to get multiple results, calculations or events out of the incoming stream. For example, one job could extract data for archiving, while another job just looks for anomalies, or event detection.
Detect special events, anomalies or trends
The canonical example, used in complex event processing, is the TollBooth or traffic speed scenario. Every car passing a toll booth or the traffic camera, results in a new event. But the added value is in detection special cases in the stream of events.
- Maybe it’s needed to automatically trigger an event if the duration of one car from one booth to another is shorter than the allowed time, because he is speeding. This event can then be processed by the backend.
- The same stream can also be used to detect traffic jams, if the average time between booths decreased in a window of time. Here it is important to take the average values, in order to avoid the extremes of cars that are very slow, or cars that speed.
- And at the same time, license plates could be matched against the reference data of suspected cars. Cars that are being sought after because they are stolen, or because they are driven by suspects of crime.
Getting started with Azure Stream Analytics
We will start with a very basic scenario, where we will send events to an Event Hub and we will execute standing queries against that stream, using ASA. This is a quick step-by-step guide to create an Analysis job.
Sending data to Azure Event Hubs
In order to create an event hub, there are a lot of blog posts and samples that explain this.
The sending of data is probably the most important part, as it defines the data structure that will be processed by the ASA job. Therefore, it is important that the event that is sent to the Event Hub is using supported structures. At the end of this post, I have some troubleshooting tips and some limitations that I encountered.
The following code snippet sends my telemetry-event to the Event Hub, serializing it as JSON.
As you can see, we are defining a TelemetryInfo object that we send multiple times (in parallel threads) to the event hub. We just have 10 devices here to simulate data entry. These json-serialized objects get UTF8-encoded and are sent in the EventData object of EventHub SDK.
Creating the Analysis job
In order to create the job, you have to make sure the subscription is enabled for Azure Stream Analytics. To do this, log on to http://account.windowsazure.com with the subscription owner and click on preview features to enable ASA.
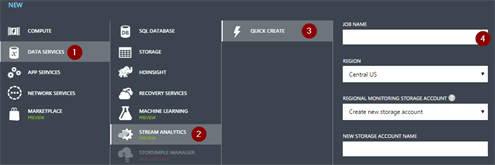
Log on to the Azure portal and click the ASA icon. There, you can create a new job. The job has to have a name, a region and a monitoring account. (there is one monitoring account for every region).
Once this is done, it is required to specify one or more inputs, the actual query and the output to which the job has to write.
Create the inputs
Select the inputs tab in your job.
Create a new input and define the input as Data Stream (constant inflow of data). Select Event Hub in the second window of the wizard, as that’s the input we want to work with. In the 3rd part of the wizard, we have to select the event hub we are sending our events to. Ideally this is in the same subscription.
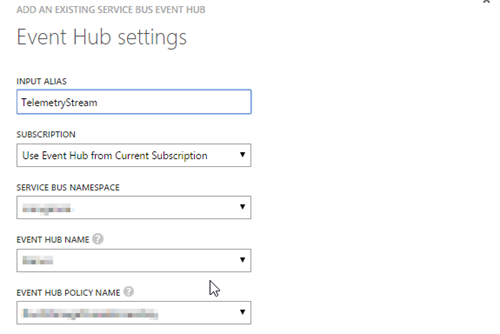
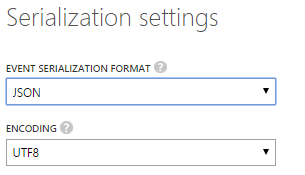
In the last part, we have to specify the encoding and serialization. We will use json as UTF8
Create the output
One job can have only one output at this moment, which is unfortunate. If you also would love to see this changed, don’t hesitate to vote on my suggestion on uservoice.
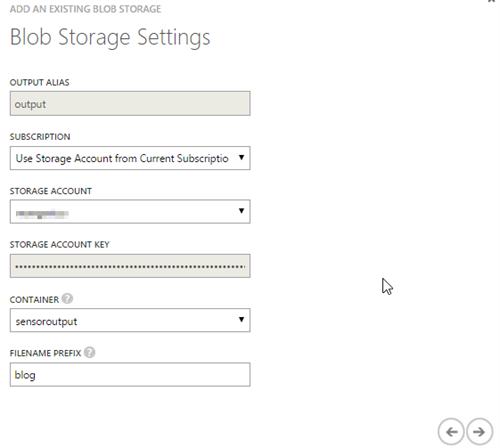
In this step, we will create a blob output that takes our stream events and outputs it in a CSV file.
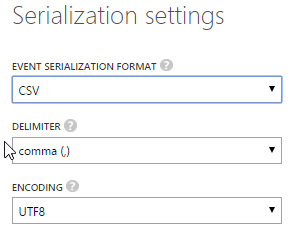
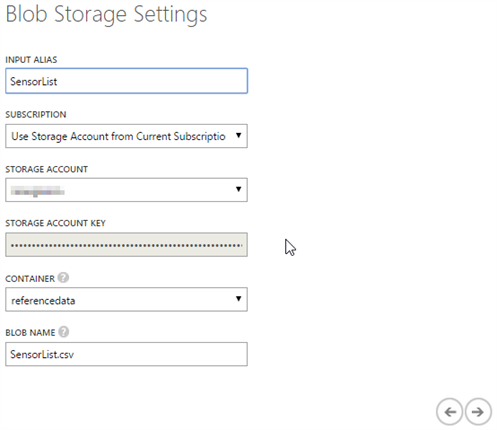
For that, we click on the Output tab and create a new one. To start, we select Blob storage. As you can see, we can also output our data to SQL Azure, or to another Event Hub. In the wizard, we have to provide our blob settings and the serialization/encoding, as you can see in the following screenshots.
Creating the query
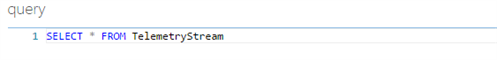
The scenario we are now implementing is really like the “hello world” example of Stream Analytics. We just take all the incoming data from the event hub and will output it to the blob storage.
Therefore, we just create the following query: SELECT * FROM TelemetryStream, where TelemetryStream is the name of our input.
Starting and testing the job
Now we have all things configured, we can start the job. And if everything goes well, we can run the producer (see above) and we should see that the data is getting written to our blob container, based on the properties we specified. This allows us to easily get data and get a basic test on which we can start defining our query to the level we need. If you have issues, please refer to the troubleshooting section of this post.
Testing queries
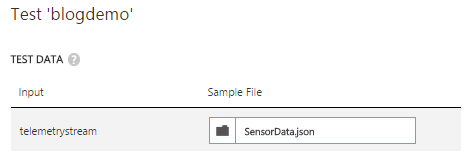
The query windows also allows users to test their queries against sample files, which is a big improvement since a few months. The only challenge one has is to get a good sample file. For that, I mostly change the output of my job to JSON/UTF and apply the SELECT * query again, resulting in a perfect good test file. I then take that json file to upload it in the test wizard. If the data is valid, you can easily test the query and see the output of the query in the bottom of the query screen.
Writing Analytics queries
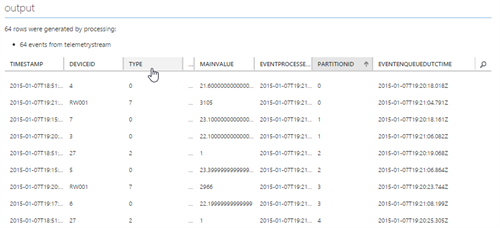
As you can see in the source code (and in the output on our blob), the data we are sending contains the following fields:
DeviceId, ErrorReading, MainValue, Type, EventProcessedUtcTime, PartitionId, EventEnqueuedUtcTime. The last 3 fields are added by ASA and can be used in the query as well.
Now we will dive a little deeper in the query language of ASA, that really feels like plain old SQL.
Time-based aggregation
One of the most common aggregation methods that is needed (explained in the noise reduction scenario) is the grouping of events by a window of time. ASA provides 3 types of windows, of which the tumbling window (fixed time intervals) is the most common. The details of these windows are explained well in the documentation. The other windowing methods are Hopping (overlapping time windows) and Sliding (flexible windowing) windows.
If we now want to aggregate the data from our sample, we can easily update the query to aggregate the sensor data per minute interval, by writing the following query:
The documentation outlines good examples and other functions.
Using reference data
It is also possible to add reference data to your query, so that this data can be used to enrich the query or take extra filters or decisions. For that, it is needed to add a new input to the query of type ‘Reference data’ and browse to an existing blob (I always use CSV files for this). In this sample, I am uploading the SensorList.csv that you can view on our github account.
Now, you can use this data to make SQL-like joins and enrich your query. I am using the SensorList.csv that is part of the Gist I created for this blog:
And this allows me to write the following join-query that adds the name of the sensor to the output on my blob.
Troubleshooting and diagnostics
I had some issues in the past days, trying to get things work. I hope this post helps others in avoiding the same issues. With this, I also want to thank the ASA team for the help they gave in fixing this.
For logging information, you should fall back on the Operation Logs of Azure that you can get to, through the dashboard of your ASA job. But (it’s a preview, don’t forget that!) there were some errors that were not visible in the logs and that required support from the team. I’ll try to list some of the limitations that I encountered here.
Data Conversion Errors
When you are getting Data Conversion errors in the log, the chance is big that you are sending an unsupported object type in your event. I had sent booleans and Arrays in my event and they were causing issues.
I created the ToJson() method in my sender (see above), where I am json-serializing a dynamic object with only the allowed types. This still allows my local application to work with all properties, I’m just making sure to remove or change the incorrect data types, before sending them (by using the dynamic object).
However, the intention is that the value of the unsupported fields will be set to NULL in an update that is expected shortly. That way, you can still process the events, even if they contain invalid data types.
There is also the possibility to declare the data structure and data types in the query. That way, you describe the data types of the different fields (without creating something specific)
The following query is an example of that
The details of the issue and the resolution I had, can be found on the msdn forum.
Next blog post
In a next blog post, I’m planning to explore the following things:
- Output data to SQL Azure
- ASA – Event Hub specifics
- Dynamic reference data
- Combining multiple input streams
Sam.
Subscribe to our RSS feed